Simple Moving Averages (SMA) and Fibonacci retracement are very important concepts related to support and resistances. Though they both differ, I chose to explain them together as their function is similar. Let’s first look into SMA.
SIMPLE MOVING AVERAGE
SMA is simply an average of the closing price of a stock for that particular SMA. The more commonly used SMA’s are 5,9,20,50 and 200. So 5 SMA is the average price of the stock in the last 5 days and 200 SMA is the average price of the stock in the last 200 days. SMA changes every day as a new price is averaged into the calculation. You can choose the type of SMA depending on the kind of trade you are looking into. As a swing trader, I usually look at 20, 50, and 200 SMA if I am planning to hold for a longer time, let’s say weeks. I would look into 5,9 and 20 SMA if I am planning to hold for days. Day traders look into similar SMA but the candle differs significantly as they look into 1, 5, 15, 30 minutes, and 1 and 4 hr candles.
Hope it is not confusing. To be more clear, SMA can be applied to minutes, hours, days, weeks, and years. Whichever time frame it is applied, SMA is still the average of that particular timeframe.
Now, let’s look at some charts to understand better.

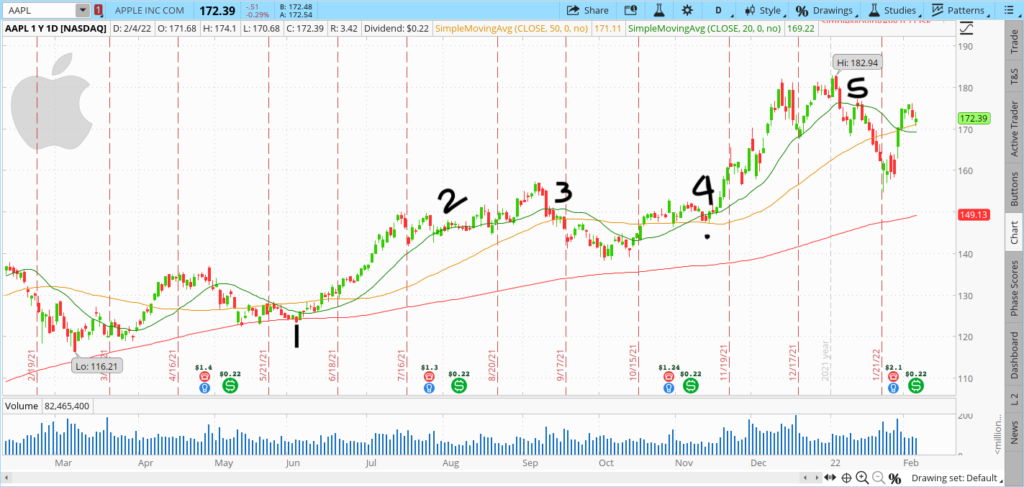
This is the daily chart of AAPLE with 20 SMA (Green), 50 SMA (Yellow), and 200 SMA (Red). At point 1, see how the price took to support and then started to go up. A stock is considered bullish if it stays above 200 SMA and bearish if it stays below 200 SMA. If i want to trade AAPL, then i would wait to see if it takes support at 200 SMA and starts to go up. Let’s consider 2 types of people here.
Swing trader – I would buy apple after 1-2 days it took support at 200 sma and starts going up. Then I would keep 20 sma as a stop loss. I will not sell apple until 20 sma is breached. For example, as per this chart, i would go long at 126$. Now, look at point 2. The price is dancing around 20 SMA but did not breach convincingly. I am not worried and continue to hold. Now at point 3, it breaks the 20 SMA and did not take support. To be clear, I would not sell at the first close below 20 sma at point 3 but I would give 1 more day to see if it’s a false breakdown. But, here it keeps falling down and I would sell around 148$. In this trade, I would have made close to 20% for a 3 month hold period which is pretty impressive.
Investor – Let’s look at the same chart from an investor point of view. An investor would have bought apple at the 200 sma support like me at 126 but since his time horizon is much longer he is not bothered by the daily price action and may only keep 200 sma as his support.
Now is also a good time to reiterate how swing trading can be lucrative. Even though I sold at 148, aapl gave another swing opportunity at point 4 where it took support at 20 and 50 SMA and starts going up. I would have bought at 152 and kept the same 20 sma as stop loss and would have sold at 172 at point 5. This would have given me a 12% gain for a 2 month holding period.
To find a setup like this, you just have to look at various stock charts with 20, 50, and 200 SMA. All it takes is constant practice and after a couple of months, you can easily find good setups like this.
FIBONACCI RETRACEMENT
Fibonacci retracement is a series of horizontal lines where traders believe support and resistance will occur. It is derived from the Fibonacci sequence, a mathematical formula from the 13th century. Fibonacci is expressed as % and includes 0, 23.6, 38.2, 50, 61.8, 78.6 and 100. You do not have to do any calculation if these percentages scare you. It’s all done for you by the brokerage software you are using. Let’s look at a chart to understand better.

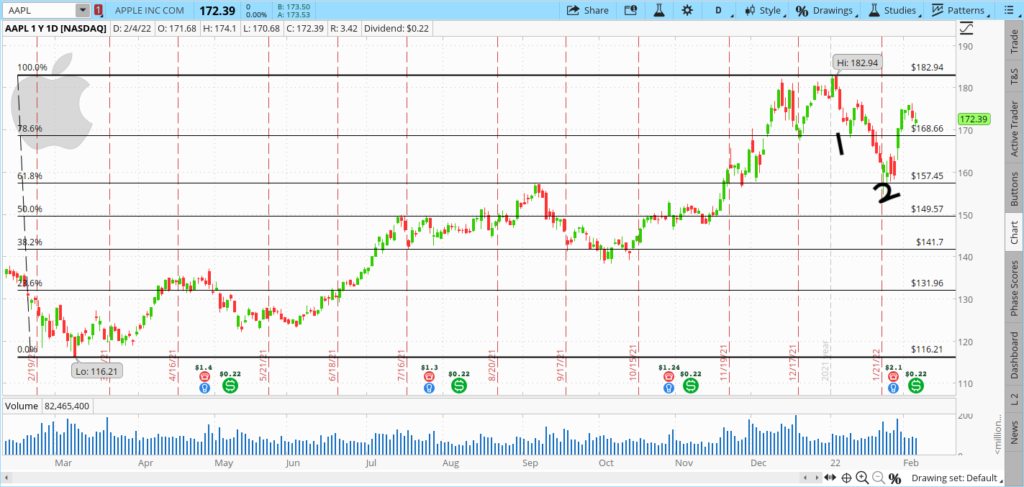
This is the same AAPL chart we used for the SMA. In this chart, we are taking the 52 weeks ( 1 year ) low and high which are 116 and 182 respectively. You go to the drawing tools in the chart and select Fibonacci. Then you start at 116 and drag it up to 182 and it gives the picture above with all the Fibonacci percentages.
Apple took support at 78.6% at point 1 and went up but eventually came down up to 61.8% at point 2 where it took found support again and start going up. This can be applied to any chart and any time frame. You just have to find a high and low price of the stock for that particular trend.
I also would like to add that all these technical indicators including SMA and Fibonacci are great but it is better to use these along with other indicators to confirm. In Technical analysis, you do not take a trade based on a single indicator. You use at least 2 or 3 indicators that all point to one direction and then take the trade. I always use the volume indicator to confirm the setup. Volume is the most important indicator in the technical analysis platform. I will discuss volume in detail in the next article.