Support and Resistance

Support and resistance are some of the very basic tools of technical analysis. You should have a clear understanding of these before you can formulate your own strategy.
Support is the stock price where more buyers step in than the sellers to support the stock price and the price stops declining further. How do you draw a support line? It is simply done by drawing a horizontal line in the chart where it touches 3 or more candles at the same price.
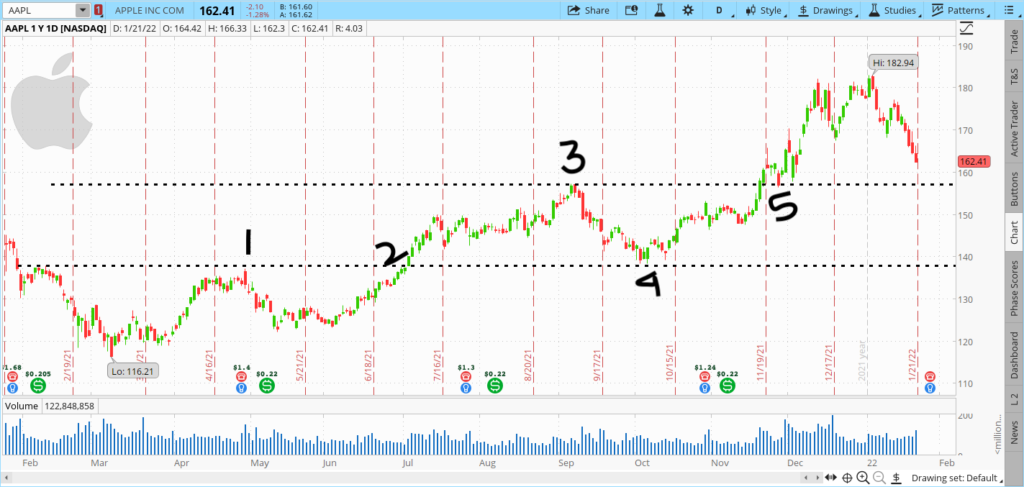
Let’s look at AAPLE, for example.

In this chart, 1,2 and 4 are the same price but at different times. 3 and 5 are the same price but at different times.
Look at 2,3 and 4 for example. The stock rose from 2, went up to 3, and fall back up to 4 but did not break that line as that is the presumed support line and buyers stepped in.
Now, Resistance is the opposite of the support where more sellers step in than buyers thereby causing the price drop.
Let’s look at 1 and 2 for example. The stock initially went up to 1 but could not break and started falling. It again went up to that level at 2, but this time it broke that resistance and started going up.
Another important lesson to learn here is, once support is broken that support will become resistance and vice versa. Confusing? consider 2. It used to be resistance but once it is broken, it becomes support at 4.
Support and Resistance can be lines drawn by connecting at least 3 candles at same price. But that does not mean, these are the only means of support and resistance. Support and resistance can be found by simple moving averages and Fibonacci retracement. More on this in the next article.